
Fixing SMART PMDA Timeouts
Dude, where are my SMART temps?
I’ve recently added a bunch of storage to a server: 4 SATA SSDs connected via the MB chipset and 8 SATA HDDs connected through a PCIe LSI HBA. All working just fine. But I woke up to this:
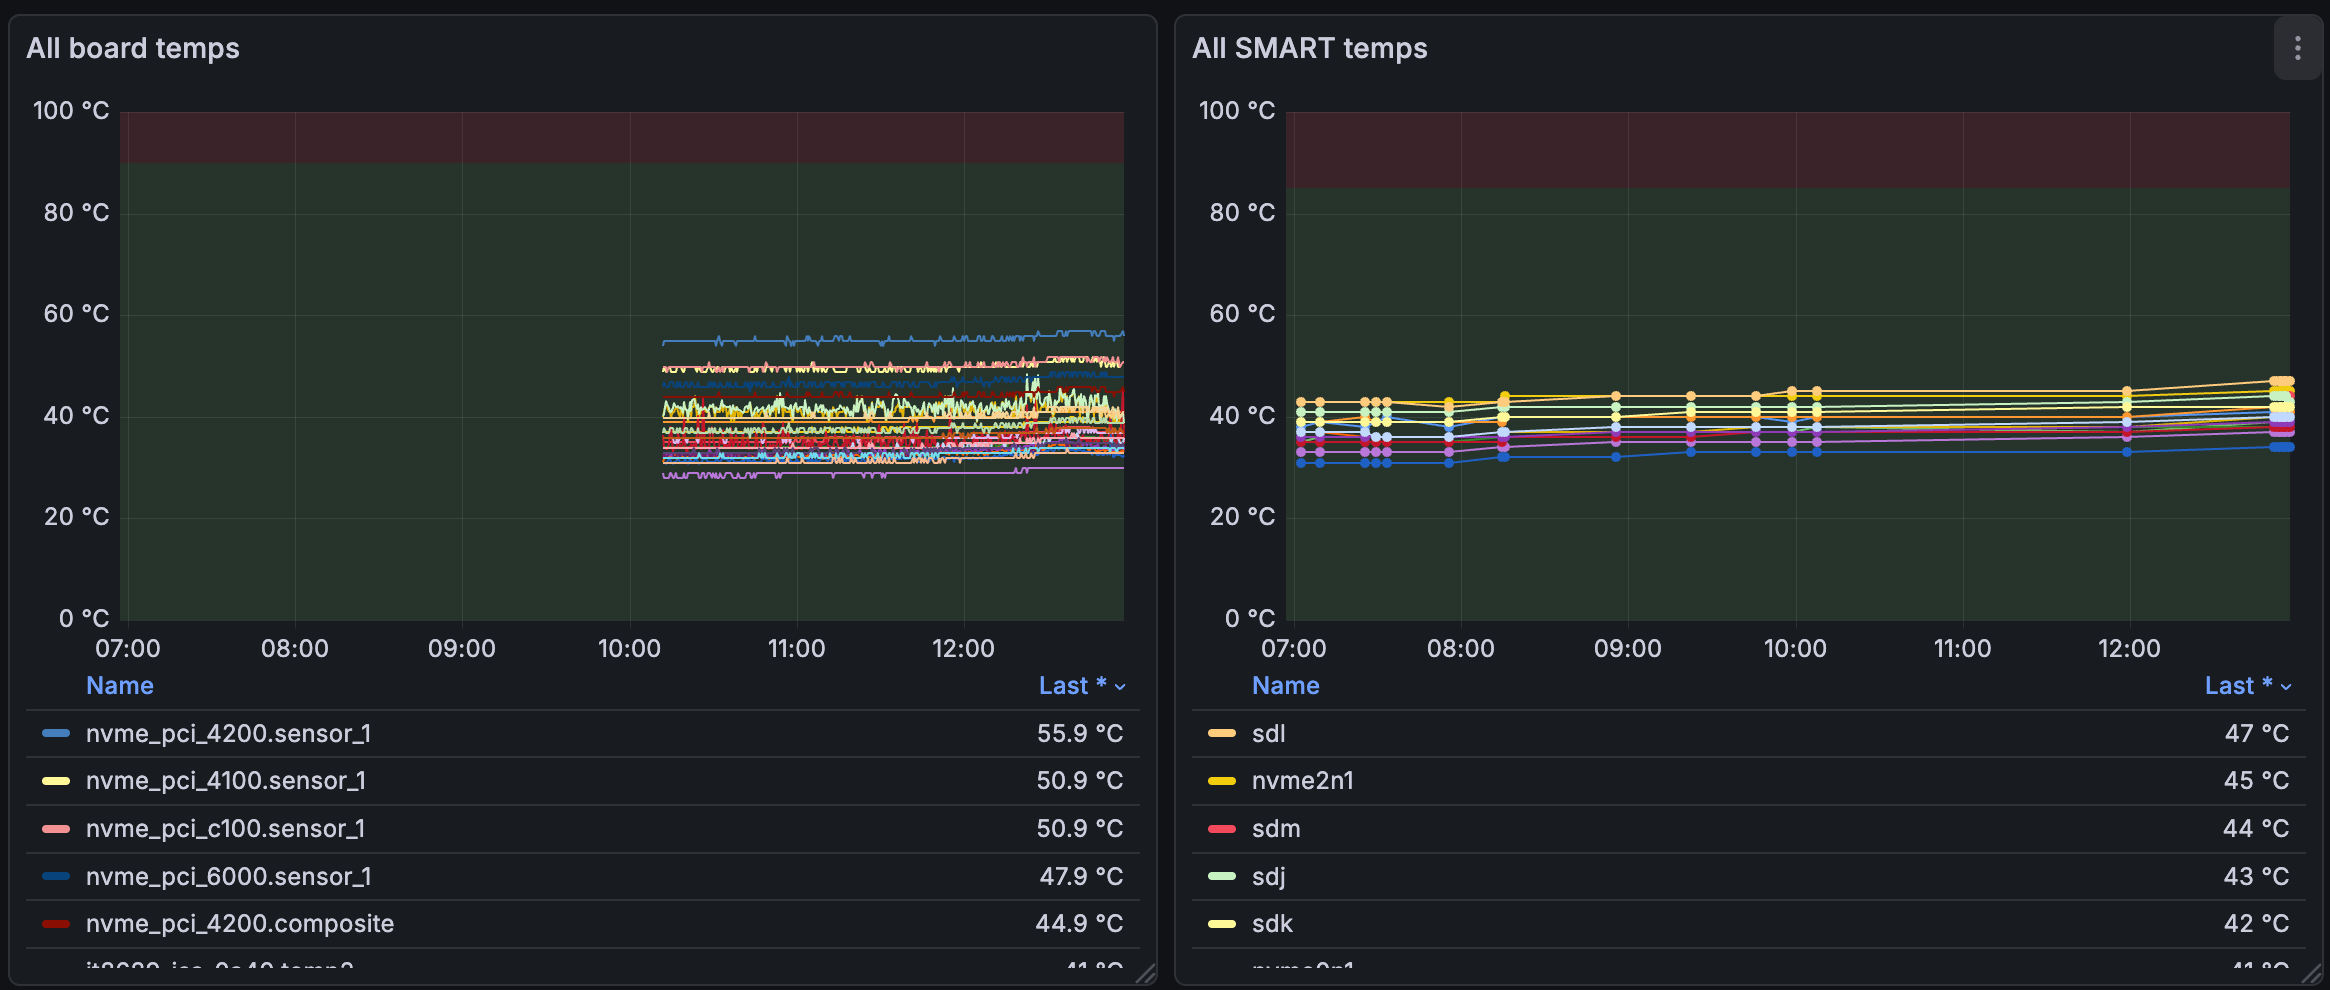
On the left, we have lmsensors metrics, expanded with it86 because my MB uses one of those blasted SuperIO chips for fan control (“SmartFan 6”). Incidentally, the sensors report temps from the 4 NVMe slots on the MB, each housing an 8TB WD Black drive.
On the right, data is pulled from SMART for each drive, on any drive port.
Both are populated by their respective PMDAs, metric agents that are emitting data to PMCD, which in turn is fed through PMLogger to Redis and finally Grafana.
The SMART data seems to disappear randomly, even though it is forced to refresh every second:
log mandatory on 1 second {
        nvidia
        smart
        lmsensors
        filesys
}
This config forces PMCD to poll the PMDA data for those four agents every second. It’s a bit much, as there’s some static data in there (you’re not hot-plugging GPUs every second, right?), but I have enough storage and I would rather not dig through the entire metrics tree. That’s why the lmsensors graph on the left is so detailed. So WTF is going on with the SMART data? This dashboard was in place before I added the new storage and worked just fine?!
Let’s just restart and see what’s what:
$ smart sudo systemctl restart pmcd
$ smart pmprobe smart.nvme_attributes.composite_temperature
smart.nvme_attributes.composite_temperature 4
Ah nice, it works! 4 metrics (for four drives) are flowing in. But wait, a second later:
$ smart pmprobe smart.nvme_attributes.composite_temperature
smart.nvme_attributes.composite_temperature -12386 No PMCD agent for domain of request
The agent disappeared?! What was the last thing it did?
$ sudo tail -n 50 /var/log/pcp/pmcd/smart.log
Log for pmdasmart on aitop started Sun Nov 23 12:23:32 2025

[Sun Nov 23 12:23:40.487304] Warning: __pmSendResult(1,...) failed: Broken pipe

Log finished Sun Nov 23 12:23:40 2025
It failed to send data, the pipe to PMCD was shut down - it ran into a closed door and gave up. Why did PMCD close the door?
$ sudo tail -n 50 /var/log/pcp/pmcd/pmcd.log
Configuration file ‘/etc/pcp/pmcd/pmcd.conf’ unchanged
Restarting any deceased agents:
    “smart” agent
    “bpftrace” agent

pmcd: unexpected end-of-file at initial exchange with bpftrace PMDA

active agent dom   pid  in out ver protocol parameters
============ === ===== === === === ======== ==========
[...]
libvirt      140 3682865  31  32   2 bin pipe cmd=/usr/bin/python3 /var/lib/pcp/pmdas/libvirt/pmdalibvirt.python
docker       141 3682870  33  34   2 bin pipe cmd=/var/lib/pcp/pmdas/docker/pmdadocker -d 141
smart        150 3686839  38  39   2 bin pipe cmd=/var/lib/pcp/pmdas/smart/pmdasmart -d 150

[Sun Nov 23 12:23:38] pmcd(3682845) Warning: pduread: timeout (after 5.000000 sec) while attempting to read 12 bytes out of 12 in HDR on fd=39
[Sun Nov 23 12:23:38] pmcd(3682845) Info: CleanupAgent ...
Cleanup “smart” agent (dom 150): protocol failure for fd=39
OK, multiple things are wrong. First off, there are read errors in the bpftrace and smart agent, they’d been marked as “deceased”, which explains why the PMDA couldn’t send any data - PMCD killed it. The timeout could be it, but the PID seems to point to libvirt’s PMDA. Let’s disable both bpftrace and libvirt metrics to isolate the smart failure:
$ cd /var/lib/pcp/pmdas/smart
$ cd ../libvirt
$ sudo ./Remove
Culling the Performance Metrics Name Space ...
libvirt ... done
Updating the PMCD control file, and notifying PMCD ...
Check libvirt metrics have gone away ... OK
$ cd ../bpftrace
$ sudo ./Remove
Culling the Performance Metrics Name Space ...
bpftrace ... done
Updating the PMCD control file, and notifying PMCD ...
Check bpftrace metrics have gone away ... OK
OK, now checking the behavior again, it seems like the SMART probe takes longer and longer to respond, before being killed:
$ sudo systemctl restart pmcd
$ time pmprobe smart.nvme_attributes.composite_temperature
smart.nvme_attributes.composite_temperature 4
pmprobe smart.nvme_attributes.composite_temperature  0,00s user 0,00s system 7% cpu 0,052 total
$ time pmprobe smart.nvme_attributes.composite_temperature
smart.nvme_attributes.composite_temperature 4
pmprobe smart.nvme_attributes.composite_temperature  0,00s user 0,00s system 6% cpu 0,051 total
$ time pmprobe smart.nvme_attributes.composite_temperature
smart.nvme_attributes.composite_temperature 4
pmprobe smart.nvme_attributes.composite_temperature  0,00s user 0,00s system 0% cpu 4,838 total
$ time pmprobe smart.nvme_attributes.composite_temperature
smart.nvme_attributes.composite_temperature -12386 No PMCD agent for domain of request
pmprobe smart.nvme_attributes.composite_temperature  0,00s user 0,00s system 0% cpu 3,467 total
$ sudo tail -n 50 /var/log/pcp/pmcd/pmcd.log
[Sun Nov 23 13:19:49] pmcd(3857845) Info:

pmcd RESTARTED at Sun Nov 23 13:19:49 2025

Restarting any deceased agents:
    “smart” agent

[...]

[Sun Nov 23 13:19:49] pmcd(3857845) Info: PMNS file “DEFAULT” is unchanged
[Sun Nov 23 13:19:55] pmcd(3857845) Warning: pduread: timeout (after 5.000000 sec) while attempting to read 12 bytes out of 12 in HDR on fd=34
[Sun Nov 23 13:19:55] pmcd(3857845) Info: CleanupAgent ...
Cleanup “smart” agent (dom 150): protocol failure for fd=34
OK that starts to make sense: the last successful probe took nearly 5 seconds, and the next one failed. PMCD is enforcing a 5-second timeout, and our polling forces a 1 second refresh. Let’s change the forced refresh to 10s for the SMART PMDA, and also adjust the PMCD timeout to match:
log mandatory on 1 second {
        lmsensors
}

log mandatory on 10 second {
        nvidia
        smart
        filesys
}
And adjust the timeout config in /etc/pcp/pmcd/pmcd.options:
# longer IPC timeout delay for slow agents (default 5)
-t 10
OK, seems to work:
$ sudo systemctl restart pmcd
$ pmprobe -v pmcd.control.timeout
pmcd.control.timeout 1 10
$ time pmprobe smart.nvme_attributes.composite_temperature
smart.nvme_attributes.composite_temperature 4
pmprobe smart.nvme_attributes.composite_temperature  0,00s user 0,00s system 0% cpu 5,533 total
$ time pmprobe smart.nvme_attributes.composite_temperature
smart.nvme_attributes.composite_temperature 4
pmprobe smart.nvme_attributes.composite_temperature  0,00s user 0,00s system 4% cpu 0,088 total
Timing fluctuates a bit, but 10s gives us enough headroom. The reason for the delay is data availability. The default polling is advisory for most metrics, and once for one-offs:
$ grep ‘^log’ /var/lib/pcp/config/pmlogger/config.default | sort | uniq
log advisory on 5 minutes {
log advisory on default {
log advisory on once {
log mandatory on 10 second {
log mandatory on 1 second {
I’m pushing the system a bit with tight mandatory polling, and SMART doesn’t care how fast you want the data. But this works for now.
The naming in PMLogger is a bit odd, but one way to think about mandatory vs. advisory is: mandatory is like CSS’s important - it always wins and sets the specific logging period. PMDAs might provide advisory periods, i.e. if no one requests mandatory logging for this metric, maybe do it every so often (the timing is defined by the advisory). Mandatory also defends against any overrides by PMLC. TL;DR:
if mandatory == on:
    log it (at mandatory interval)
elif mandatory == off:
    do NOT log it
elif mandatory == maybe:
    if advisory == on:
        log it (at advisory interval)
    else:
        do NOT log it
One sensible thing to do here would be to specify the metrics I’m actually interested in. Currently, every 10s, the entire SMART PMDA is polled. But I plan to keep this while I’m building out the dashboard. After that, I can disable the metrics I’m not interested in. PMLC is a nice tool for interactive configs, but remember that our PMLogger config overrides this:
$ pmlc
Performance Co-Pilot Logger Control (pmlc), Version 7.0.3

pmlc> show loggers
The following pmloggers are running on local::
    primary (3898924)
pmlc> connect primary
pmlc> status
pmlogger [primary] on host local: is logging metrics from host aitop
PMCD host        aitop
log started      Sun Nov 23 13:30:22.133330434 2025 (times in local time)
last log entry   Sun Nov 23 13:41:47.612559601 2025
current time     Sun Nov 23 13:41:47.912865078 2025
log volume       0
log size         2121756
pmlc> query smart.nvme_attributes.composite_temperature
smart.nvme_attributes.composite_temperature
    adv  off nl              [0 or “sda”]
    adv  off nl              [1 or “sdb”]
    adv  off nl              [2 or “sdc”]
    adv  off nl              [3 or “sdd”]
    adv  off nl              [4 or “sde”]
    adv  off nl              [5 or “sdf”]
    adv  off nl              [6 or “sdg”]
    adv  off nl              [7 or “sdh”]
    adv  off nl              [8 or “sdi”]
    adv  off nl              [9 or “sdj”]
    adv  off nl              [10 or “sdk”]
    adv  off nl              [11 or “sdl”]
    adv  off nl              [12 or “sdm”]
    adv  off nl              [13 or “nvme3n1”]
    adv  off nl              [14 or “nvme2n1”]
    adv  off nl              [15 or “nvme1n1”]
    adv  off nl              [16 or “nvme0n1”]
A “query smart” prompt would also give you a good idea of how long a full tree probe takes.
To help with debugging issues that happen “overnight,” I also want to revisit the retention periods. We have three components in play:
PMCD serves metrics live (in RAM), no retention, what isn’t logged is lost
PMLogger writes metrics to disk (as the name implies)
PMProxy + Redis format the data for Grafana as timeseries
2 and 3 have retention periods.
PMLogger runs a log rotation job, and keeps k days of metrics on disk. This parameter can be changed in XXX:
$ grep PMLOGGER_INTERVAL /etc/default/pmlogger
# PMLOGGER_INTERVAL=60
$ sudo nano /etc/default/pmlogger_timers
# change/add: PMLOGGER_DAILY_PARAMS="-E -x 14 -k 180"
$ sudo systemctl restart pmlogger
This means:
-E: don’t bail out on minor metadata issues (default)-x 14: compress archives older than 14 days-k 180: delete archives older than 180 days
And in /etc/pcp/pmproxy/pmproxy.conf, add, for example:
[pmseries]
stream.expire = 2592000   # TTL in seconds
stream.maxlen = 43200     # max samples per metric/host
Regarding the PMDA timeouts, your detailed breakdown of the data flow to grafana was so clear. I really appreciate how thoroughly you debugged this. Very insightful!